Let’s break down (ROAS)—Return on Ad Spend—in plain terms. It’s the metric to measure and tell you if your ads are pulling their weight or just burning through your advertising spend. Think of it as the ultimate scoreboard for your marketing efforts. Are your campaigns killing it, or do they need a serious rethink? ROAS lays it all out.

Here’s how it works: ROAS measures how much revenue you’re making for every dollar you spend on advertising. For example, spend $1 and bring in $3? That’s a 3:1 ROAS. Pretty straightforward, right? But here’s the thing—once you dig into how to calculate it accurately and actually use it to improve your strategy, it gets a bit more interesting (and yes, a little tricky).
What about you? Have you looked at good ROAS ratio and campaigns? Or maybe you’re wondering how to make sense of it? Let’s talk about it
What is ROAS and Why is it Important?
ROAS isn’t just a random data point—it’s a key performance indicator (KPI) that every marketer swears by. It’s the compass that guides advertising decisions and ensures that every dollar invested is working toward generating real, measurable revenue.
The importance of ROAS lies in its numerous benefits. For starters, it’s a performance checker, revealing which campaigns are nailing their goals and which are missing the mark. Budget optimization is another reason why ROAS is critical; by understanding which tactics generate the most revenue, marketers can allocate resources more efficiently.
Furthermore, a high ROAS serves as a window into audience behavior, showcasing what messaging and offers resonate best. Ultimately, it’s a decision-making powerhouse, helping answer the question: Are our marketing efforts actually paying off? Whether it’s to justify ad spend or to tweak campaigns, ROAS is every marketer’s guiding light.
How is ROAS Calculated?
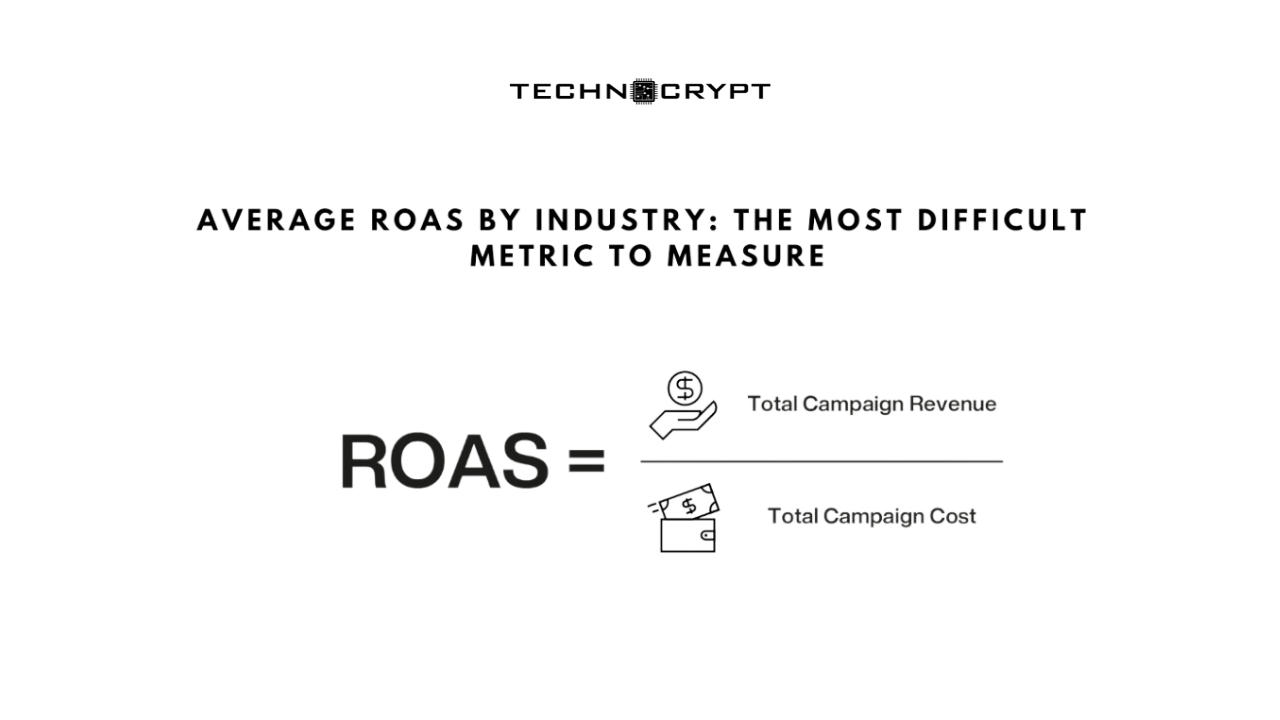
Let’s look into the numbers involved—it’s actually quite simple. The ROAS formula is:
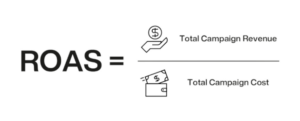
ROAS = (Revenue from advertising / Total ad spent) × 100
For example, let’s say you spent $2,000 on Google paid ads in a month and those ads generated $10,000 in revenue, allowing you to ,calculate ROAS effectively. Plug those numbers into the formula:
($10,000 / $2,000) × 100 = 300% return on investment.
This means a ROAS of 5, for every dollar spent, you earned five. That’s a ROAS of 5:1, a solid return by most standards. While the math is straightforward, the interpretation isn’t always so clear-cut. Industry norms, business models, and campaign goals all play a role in what constitutes a “good” ROAS. It’s an excellent tool to monitor ROAS and refine your approach. Many businesses also use tools like a ROAS calculator to simplify this process.
What Makes ROAS a Challenging Metric to Measure?
While ROAS seems like a dream metric, measuring it accurately can feel like untangling a thread. The first hurdle is data discrepancies. Different ad platforms and analytics tools use varied tracking methods, often resulting in conflicting numbers when attempting to calculate ROAS. This discrepancy makes reconciling data a frustrating task.
Another challenge is attribution. Nowadays, customers interact with brands across numerous touchpoints before making a purchase. Was it the Instagram story that nudged the sale, or the email follow-up? Pinpointing which interaction deserves credit for the revenue can be downright perplexing.
Then there’s the issue of data quality. Technical glitches, human errors, and even bots can muddy your ROAS calculations. And let’s not forget the complexity of tracking interactions across multiple channels—customers rarely take a linear path to purchase. All these factors combined make ROAS both invaluable and incredibly tricky to measure accurately.
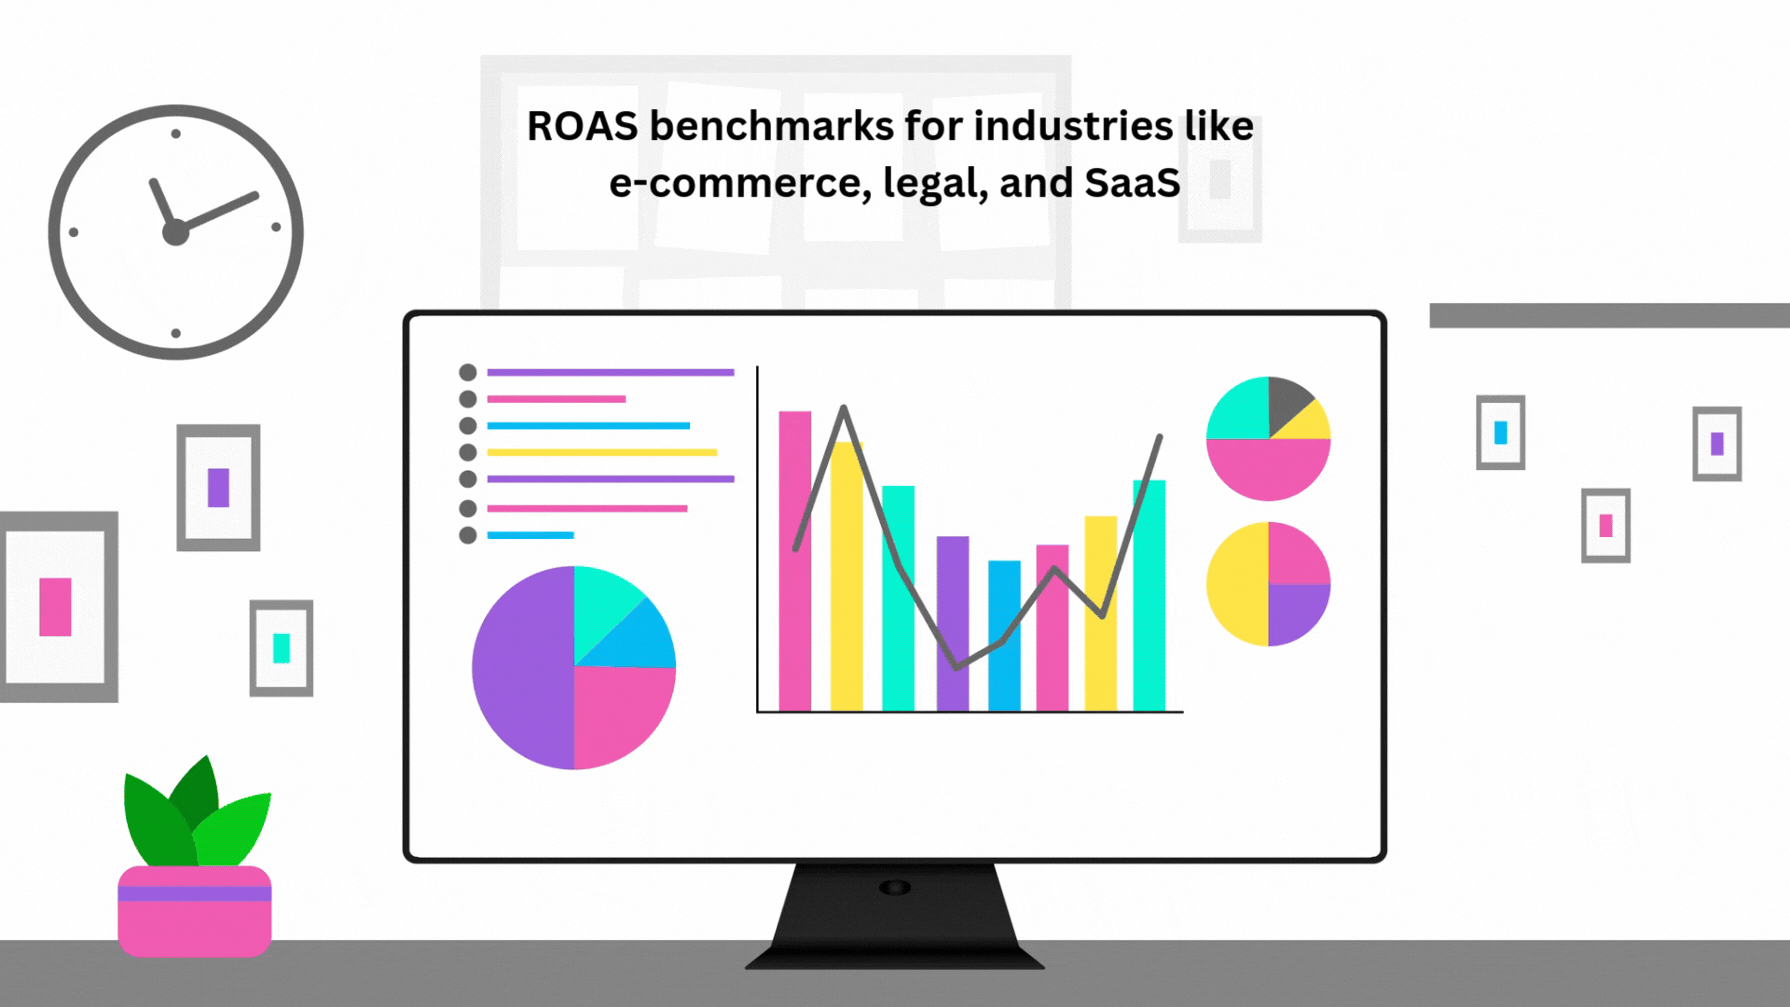
Industry-Specific ROAS Benchmarks: What Do They Look Like?
When it comes to ROAS, one size does not fit all. Each industry has its unique dynamics, which means benchmarks can vary widely. Industries with high customer demand and visually appealing products, like apparel and accessories, tend to achieve exceptional ROAS. On Google Ads, these sectors often boast figures as high as 24.73.
On the other hand, sectors like technology and legal services generally see lower ROAS, averaging around 1.90:1 and 1.55:1, respectively. This isn’t necessarily a failure—it’s a reflection of the high acquisition costs and niche audiences typical in these industries, impacting the return on ad spend. Understanding these benchmarks is critical for setting realistic goals and accurately evaluating your campaign’s success.
How Do E-commerce ROAS Metrics Compare to Other Sectors?
ROAS targets vary depending on the industry. E-commerce businesses often achieve higher ROAS, while sectors like legal services and B2B might see lower figures due to longer sales cycles. Key benchmarks include:
- E-commerce ROAS: Average 2.87:1
- CPG (Consumer Packaged Goods): Typically moderate due to thin profit margins
- Technology & SaaS: Lower ROAS but justified by high customer lifetime value
Knowing the average ROAS figures for your industry verticals provides realistic targets for campaigns.
What ROAS Should Service-Based Industries Aim For?
Service-based industries operate on different benchmarks, often targeting higher ROAS due to their distinct business models. General service businesses should aim for a ROAS of 6:1 or higher, reflecting the long-term value that customers often provide.
B2B and SaaS companies, which deal with extended sales cycles and higher acquisition costs, typically target lower ROAS, between 2:1 and 3:1. Legal services average around 1.55:1, but higher benchmarks should be pursued for more significant returns. Ultimately, the “right” ROAS for service-based industries depends on factors like profit margins, competition, and customer lifetime value.
Factors Influencing ROAS: What Should You Consider?
ROAS is influenced by numerous variables, from the platforms you advertise on to the external economic climate. Platforms like Google Ads often yield higher ROAS, thanks to their intent-driven audiences, while social platforms like Instagram may offer moderate returns, emphasizing visual appeal over direct intent.
Seasonality also plays a significant role. Retailers often see spikes during holiday seasons and dips during quieter months. Additionally, factors like ad quality, audience targeting, and bidding strategies can make or break a campaign’s ROAS.
How Do Advertising Platforms Impact ROAS Across Industries?
Platform Key Features Average ROAS Industries Benefited
Google Ads Intent-driven marketing 13.76 Most industries; suited for high-intent searches
Facebook Ads Audience engagement 10.68 Versatile; good for brand awareness and conversions
Instagram Ads Highly visual platform 8.83 Fashion, beauty, lifestyle industries
Amazon Ads Purchase-ready audience 7.95 E-commerce businesses
| Platform | Key Features | Average ROAS | Industries Benefited |
|---|---|---|---|
| Google Ads | Intent-driven marketing | 13.76 | Most industries; suited for high-intent searches |
| Facebook Ads | Audience engagement | 10.68 | Versatile; good for brand awareness and conversions |
| Instagram Ads | Highly visual platform | 8.83 | Fashion, beauty, lifestyle industries |
| Amazon Ads | Purchase-ready audience | 7.95 | E-commerce businesses |
What Role Do Seasonal Trends Play in ROAS Measurement?
Seasonality is shaping your ROAS, and ignoring it can lead to skewed results and poor decision-making. Consumer behavior ebbs and flows throughout the year, driven by holidays, sales events, and even weather patterns. For instance, retail businesses often see their ROAS skyrocket during Black Friday or Christmas shopping sprees, but they may struggle during off-peak seasons like mid-January.
To effectively navigate these fluctuations, it’s crucial to analyze historical data. Compare current campaign performance to similar periods in past years to identify trends. Then, adjust your spending accordingly—investing more during high-demand periods and scaling back during quieter times. Remember, interpreting ROAS in a seasonal context ensures your strategy remains agile and effective year-round.
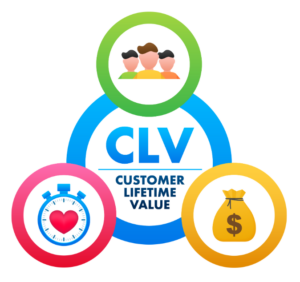
How Can Customer Lifetime Value (CLV) Affect Your ROAS?
ROAS and Customer Lifetime Value (CLV) are like two sides of the same coin. While ROAS focuses on the immediate returns from your ad spend, CLV considers the long-term value a customer brings over their relationship with your business.
By incorporating CLV into your ROAS calculations, you gain a clearer picture of profitability. For instance, a campaign with a lower initial ROAS might still be valuable if it attracts customers who make repeat purchases over time. This extended time horizon allows businesses to strike a balance between short-term wins and long-term growth.
Additionally, CLV-adjusted ROAS helps you make smarter decisions about customer acquisition costs, ensuring a better return on investment. Instead of fixating on immediate returns, you can focus on strategies that maximize lifetime profitability. For industries like SaaS or subscription services, this approach is particularly effective, ensuring your marketing dollars deliver sustainable results and a favorable ROAS by industry.
Strategies to Improve ROAS: What Actions Can You Take?
- Create Engaging, Relevant Ads
- Refine Targeting and Segmentation
- Test and Adjust Bidding Strategies
- Optimize Landing Pages
- Leverage Data and Analytics
- Enhance Ad Quality Scores
- Stay Up-to-Date on Trends
What Are Effective Campaign Strategies to Enhance ROAS?
To boost your ROAS, think strategically about your campaigns. Start by leveraging ad extensions. These add-ons—like sitelinks, callouts, and structured snippets—provide additional information and engagement opportunities, making your ads more visible and clickable, ultimately improving your average ROAS for Google.
Retargeting campaigns are another must-have strategy. By serving ads to users who’ve previously visited your website or added items to their cart, you can remind them of what they’re missing and nudge them toward completing their purchase.
Keyword optimization is crucial as well. Continuously refine your keyword list to target high-intent search terms while excluding irrelevant ones with negative keywords. This ensures your ads reach the right audience without wasting spend on unqualified clicks.
Finally, focus your efforts on high-performing channels. Analyze your ROAS across platforms and allocate more budget to those delivering the best results. For underperforming channels, take a step back, reassess, and make adjustments to improve their efficiency.
How Can Targeting and Segmentation Improve Your ROAS?
Effective targeting and segmentation are the backbone of a high-ROAS strategy. The more you know about your audience, the better you can tailor your messaging to meet their needs. Advanced segmentation lets you divide your audience into detailed groups based on factors like browsing behavior, purchase history, and engagement patterns.
This level of personalization enhances ad relevance and increases the likelihood of conversion. For example, you can create lookalike audiences—new potential customers who share characteristics with your existing high-value clients. Similarly, dynamic segmentation allows you to update audience groups automatically based on real-time data, ensuring your campaigns stay relevant and impactful.
What Tools and Technologies Can Help You Track and Optimize ROAS?
Analytics Platforms
Analytics platforms offer the foundational data needed to track performance and identify areas for improvement.
- Google Analytics: Tracks campaign performance, audience behavior, and conversion paths. 

- Marketing CloudFX: Provides advanced insights into ad performance and traffic sources.

Advanced Attribution and Dashboards
For detailed tracking and visualization, these tools enable real-time monitoring and comprehensive attribution.
- Ruler Analytics: Focuses on multi-touch attribution, linking revenue to specific campaigns. 

- Cyfe: Offers customizable dashboards to consolidate and analyze data from multiple platforms.

Behavioral Analysis Tools
Understanding user behavior is critical to identifying and fixing conversion barriers.
- Hotjar: Provides heatmaps and session recordings to pinpoint issues in the user journey.

- Kissmetrics: Tracks user behavior over time, offering insights into trends and conversion challenges.

SEO and Content Performance Tools
SEO tools help monitor and improve keyword rankings, ad visibility, and content engagement.
- SEMrush: Analyzes keyword performance, ad campaigns, and backlink strategies. 

- Ahrefs: Tracks search engine visibility and provides competitor analysis for content optimization.

Common Mistakes in Measuring ROAS Ratio: What Should You Avoid?
When it comes to ROAS, certain pitfalls can lead to misleading results. One common mistake is ignoring the full cost of advertising. Many marketers only consider ad spend, neglecting associated costs like creative development, management fees, or the cost of goods sold. This oversight can inflate ROAS and give a false sense of success.
Another frequent error is focusing solely on short-term revenue. ROAS is often calculated based on immediate returns, but this approach fails to account for long-term customer value, repeat purchases, or brand-building effects, which are crucial for calculating ROAS accurately.
Poor data tracking and attribution are also significant challenges. Without accurate data, your ROAS calculations are unreliable. Invest in robust tracking systems and proper attribution models to ensure your results reflect reality.
Conclusion: How to Navigate the Challenges of Measuring ROAS
Measuring ROAS is an art and a science, blending data accuracy with strategic insight. To navigate its complexities, focus on holistic measurement—considering all costs and the full customer journey. Context is everything; understand how industry benchmarks, business models, and marketing goals shape your ROAS targets.
Adopt a long-term perspective, balancing short-term wins with lifetime customer value. Regularly test, analyze, and refine your strategies, and don’t shy away from embracing new technologies to optimize your campaigns. Remember, mastering ROAS is an ongoing process that rewards persistence and adaptability.